Query of the week #2: Manipulating Optical Coherence Tomography data in PySpark
Hi!
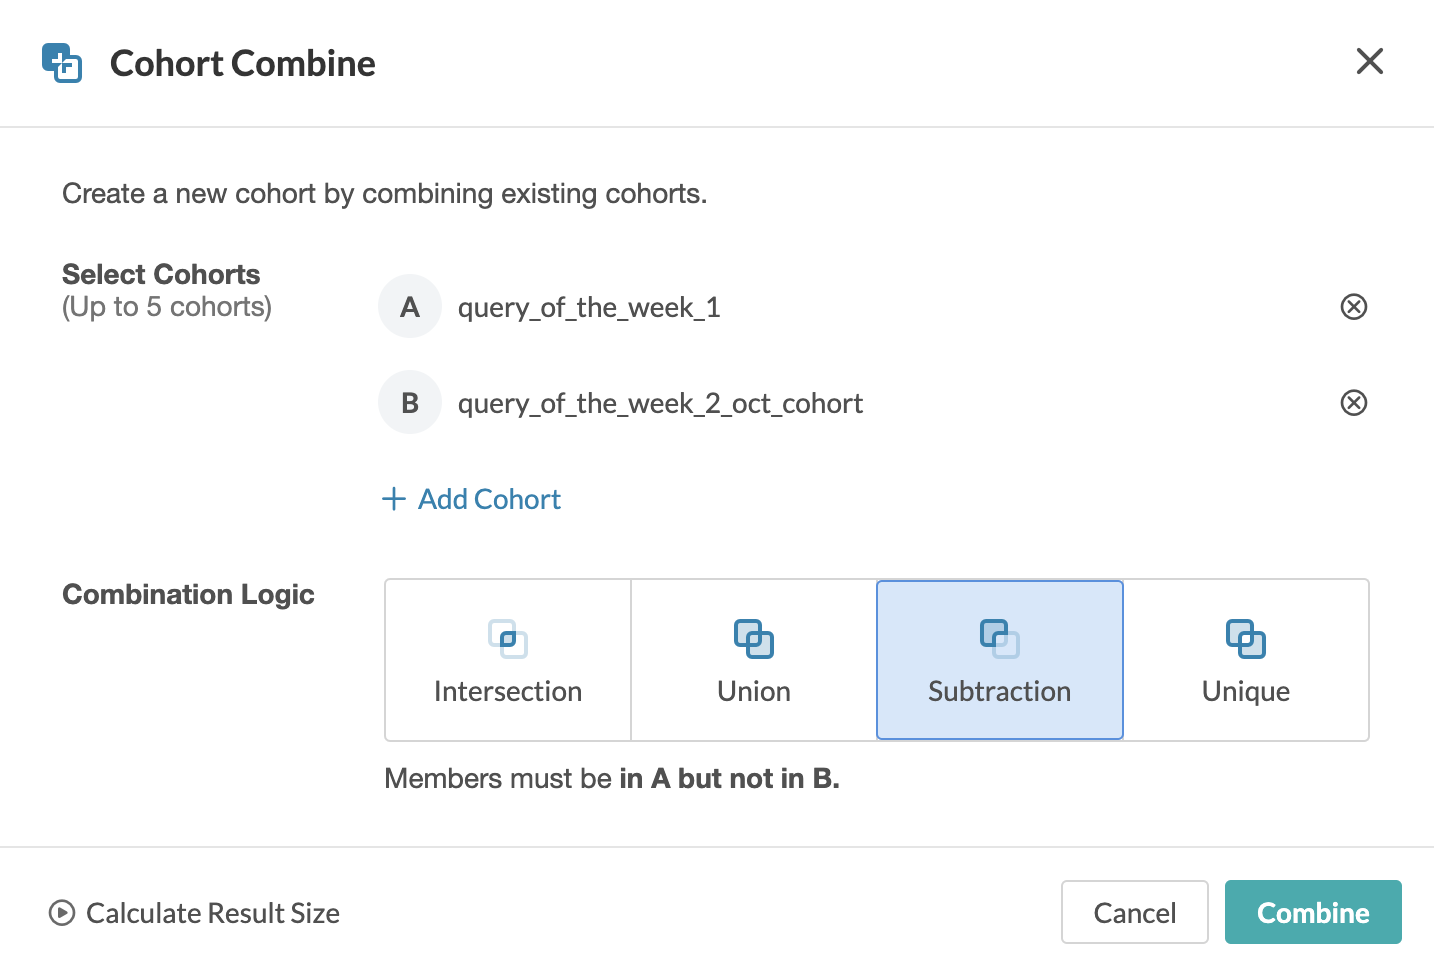
Cohort browser is a fast and simple way to apply filters and query data from UKB RAP, and I use it a lot. To design cohorts according to complex filter criteria directly in the Cohort Browser, the Compare/Combine Cohorts function is offered [1].
 Today, however, I would like to focus on a programmatic approach, which can have better reproducibility and allows implementing really advanced queries. As for the data we will work with, we will focus on derived phenotypes from Optical Coherent Tomography (OCT) Imaging and put them in context with the ICD10 diagnosis.
Let's say that this is the query we want to implement.
Show me all participants who meet the following conditions:
A) for the left and right eye, they have the OCT measurement data filled out
B) for the left and right eye, a measurement was made and the value of the parameter Overall macular thickness greater than 250 micrometres was recorded
C) filter only participants who were diagnosed with ICD10 H353**
**ICD-10 code H35.3
Degeneration of macula and posterior field is a medical classification as listed by WHO under the range - Diseases of the eye and adnexa.
Field names of our interest are:
eid Participant ID
p6072_i1 OCT measured (left)
p6070_i1 OCT measured (right)
p27800_i1 Overall macular thickness (left)
p27801_i1 Overall macular thickness (right)
p41270 Diagnoses - ICD10
To implement such a query, we will need Spark based JupyterLab and some code to provide Spark functionality. More info and even more examples could be found in [2]. My code is available here (copy and paste it to the JupyterLab notebook cells):
# import required libs and activate Spark
import pyspark
import dxpy
import dxdata
sc = pyspark.SparkContext()
spark = pyspark.sql.SparkSession(sc)
# programmatic way how to get info about dispensed dataset which we need for our queries
dispensed_database_name = dxpy.find_one_data_object(classname="database", name="app*", folder="/", name_mode="glob", describe=True)["describe"]["name"]
dispensed_dataset_id = dxpy.find_one_data_object(typename="Dataset", name="app*.dataset", folder="/", name_mode="glob")["id"]
dataset = dxdata.load_dataset(id=dispensed_dataset_id)
participant = dataset["participant"]
# define field field names of our interest
field_names = ["eid", "p6072_i1", "p6070_i1", "p27800_i1", "p27801_i1", "p41270"]
df = participant.retrieve_fields(names=field_names, engine=dxdata.connect())
from pyspark.sql.functions import array_contains # for convenient filtering of ICD10 arrays, we need to import array_contains func
df.filter("p6070_i1 is not NULL AND p6072_i1 is not NULL AND p27800_i1 > 250 AND p27801_i1 > 250").filter(array_contains(df.p41270, "H353")).show() # THE EXAMPLE QUERY ITSELF
The advantage of Spark is that it has many possibilities of logical operations for joining tables. We all probably know database operations such as join, inner join, left join, etc. Recently, I have been fascinated by more "exotic" operations - namely anti join. https://sparkbyexamples.com/spark/spark-sql-left-anti-join-with-example/?utm_content=cmp-true
As an output from the executed query, eids can be exported. This can be useful for downstream processing, e.g. if you want to work only with selected bulk OCT data and apply your own interesting algorithms on it. And that's all for today!
...
Do you want more? :). Today we are using OCT data as a demonstration phenotype, so I am adding a bonus regarding OCT image processing.
If you would like to work with FDA or FDS formats on RAP, I would recommend reading the following post about OCT Converter Tool: https://community.dnanexus.com/s/question/0D5t000003u8rRWCAY/will-oct-converter-be-implemented-in-the-future-ie-the-oct-iamges-are-fds-and-fda-files
After processing FDA/FDS or if you decide to use OCT slices on RAP, I recommend the following post that shows how to process zipped bulk imaging files: https://community.dnanexus.com/s/question/0D5t000004EtXLYCA3/is-there-a-way-to-extract-the-bulk-imaging-data-using-the-spark-jupyter-notebook
References
[1] https://documentation.dnanexus.com/user/cohort-browser#combining-cohorts
Comments
3 comments
I would be very interested if you can think of any interesting practical example for using ANTI JOIN on UKB data?
Thanks so much for sharing this Ondrej! I love that you can programmatically generate these phenotypic datasets.
Alternatively, it seems that you can also use `dx extract_dataset` with a single node instance
```
# Get dataset id
dispensed_dataset_id = dxpy.find_one_data_object(typename="Dataset", name="app*.dataset", folder="/", name_mode="glob")["id"]
project_id = dxpy.find_one_project()['id']
dataset = (':').join([project_id, dispensed_dataset_id])
# Get field names
field_names = ["eid", "p6072_i1", "p6070_i1", "p27800_i1", "p27801_i1", "p41270"]
field_names = [f'participant.{f}' for f in field_names]
field_names_str = ','.join(field_names)
# Extract dataset with selected fields
cmd = [
'dx',
'extract_dataset',
dataset,
'--fields',
field_names_str,
'--delimiter',
',',
'--output',
'data_dictionary.csv',
]
subprocess.check_call(cmd)
```
Use https://github.com/laderast/xvhelper package to decode raw values returned by dx extract_dataset
Then select participants that meet the criteria mentioned above
```
# Read in dataset and format
import pandas as pd
df = pd.read_csv("data_dictionary.csv", index_col=0, header=0)
df = df.rename(columns=lambda x: re.sub('participant.', '', x))
# Replace NaN with string None for p41270
# Convert the values in the p41270 column from a string representation of a list to an actual list
# using ast.literal_eval()
# Note: eval will return Nonetype for string "None"
df["p41270"] = df["p41270"].replace(np.nan, "None")
df["p41270"] = df["p41270"].apply(lambda x: ast.literal_eval(x))
# Select participants that meet criteria outlined
df = df.query("(p6070_i1.isnull() == False) and (p6072_i1.isnull() == False) and (p27800_i1 > 250) and (p27801_i1 > 250)")
df[df["p41270"].str.contains('H353', regex=False)==True]
```
Hi Alexandra Lee ?, this is awesome! Thank you for posting this. I like the idea of using a single node instance (non-Spark). Spark is good for a really big data and complex queries (e.g. also combo of pheno and geno data), so you are correct, this could be a great alternative for many use cases.
Please sign in to leave a comment.