Distribution of data field 131286
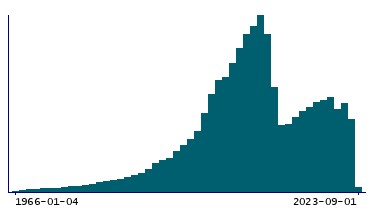
I was wondering if anybody could explain why the distribution of data field 131286 (Date I10 first reported (essential (primary) hypertension) looks like it does. Why did the reports surge, then suddenly fall?
I was wondering if anybody could explain why the distribution of data field 131286 (Date I10 first reported (essential (primary) hypertension) looks like it does. Why did the reports surge, then suddenly fall?
Comments
1 comment
I suggest you have a look in related field 131294 https://biobank.ndph.ox.ac.uk/showcase/field.cgi?id=131287 which gives the source of report of I10, Resource 593 https://biobank.ndph.ox.ac.uk/showcase/refer.cgi?id=593 which describes the First Occurrences fields, Resource 591 https://biobank.ndph.ox.ac.uk/showcase/refer.cgi?id=591 which explains that UKB only has GP data for 45% of participants, and field 53 https://biobank.ndph.ox.ac.uk/showcase/field.cgi?id=53 which gives the dates at which participants attended a UKB assessment centre.
I do not actually know the answer, so if you need to know for sure you will need to plot all the different sources by date separately.
I notice that the surge appears to fit approximately with the dates 2006-2010, when the UKB participants all attended a baseline assessment centre visit. During those four years, almost any hypertension that the participants were aware of would have been captured as a self-report. For any hypertension diagnosed after 2010, field 131294 relies mostly on linked data from Hospital and GP records. Participants who have not been in hospital as an inpatient since diagnosis, and who are in the 55% for whom we do not receive GP data, could have hypertension diagnosed after 2010 without appearing in the graph. About 100k participants have also attended further UKB assessment centre visits, instances 1/2/3, and would have been asked to self-report at those visits, but the other 400k have not.
I did wonder if there could have been a new diagnosis code introduced, but I can't find any suggestion of it. A similar pattern is visible in other fields, such as 131294, so I think the self-reports are probably the cause.
I do not know whether hypertension most commonly arises at a particular age. If so, this could be having a small effect too. However, the UKB population has an age range of about 30 years, so it couldn't have as dramatic a drop as we see in the graph.
Please sign in to leave a comment.